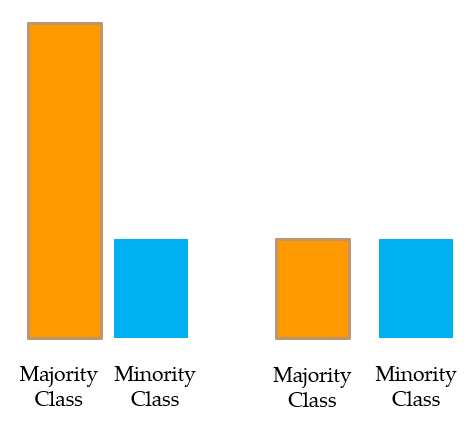
[Machine Learning] Imbalanced dataset
Imbalance problem
Most machine learning algorithms assume data equally distributed. So when we have a class imbalance, the machine learning classifier tends to be more biased towards the majority class, causing bad classification of the minority class.
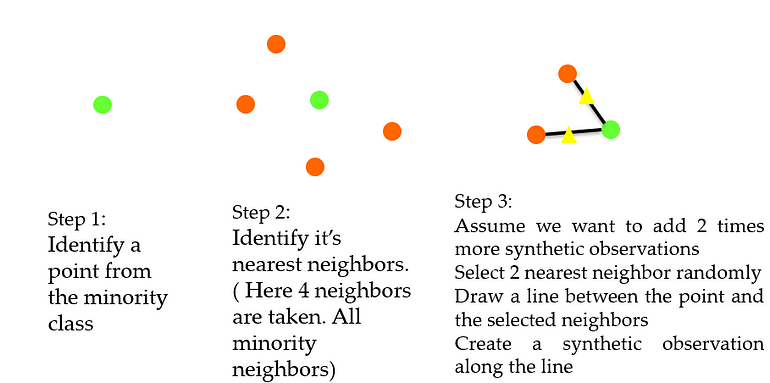
SMOTE (Synthetic Monority Oversampling TEchnique)
- a random example from the minority class is first chosen. Then k of the nearest neighbors for that example are found (typically k=5).
- A randomly selected neighbor is chosen and a synthetic example is created at a randomly selected point between the two examples in feature space.
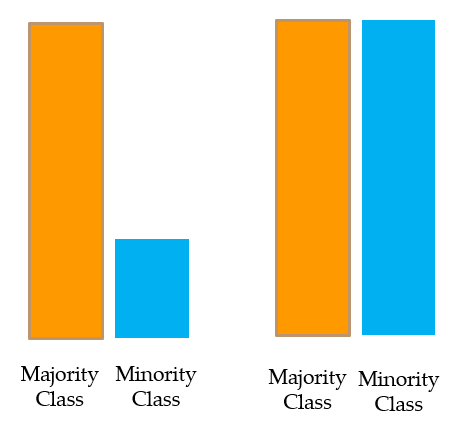
- SMOTE + RandomUnderSampler is fine
Resampling
UnderSampling
Oversampling
SMOTE

An issue with SMOTE
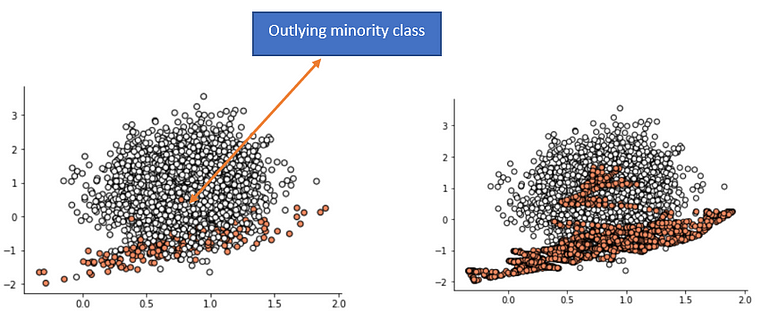
Borderline SMOTE

Setup
import warnings
from warnings import simplefilter
# ignore all future warnings
simplefilter(action='ignore', category=FutureWarning)
!pip install imblearn
import imblearn
print(imblearn.__version__)
0.8.1
import numpy as np
import pandas as pd
import matplotlib.pyplot as plt
%matplotlib inline
from sklearn.ensemble import RandomForestClassifier
from sklearn.model_selection import train_test_split
from sklearn.metrics import confusion_matrix, classification_report, roc_curve, auc
Make dataset
# define dataset
from sklearn.datasets import make_classification
X_org, y_org = make_classification(n_samples=10000, n_features=2, n_redundant=0,
	                       n_clusters_per_class=1, weights=[0.99], flip_y=0,
                           random_state=1)
X_org.shape, y_org.shape
((10000, 2), (10000,))
# Imbalanced dataset
len(y_org[y_org==0]), len(y_org[y_org==1])
(9900, 100)
markers = ['o', '+']
for i in range(2):
    xs = X_org[:, 0][y_org == i]
    ys = X_org[:, 1][y_org == i]
    plt.scatter(xs, ys, marker=markers[i], label=str(i), s=3)
plt.legend()
plt.show()

# Utility function for printing result

def print_result(X_train, X_test, y_train, y_test):

    model = RandomForestClassifier(n_estimators=100, max_depth=5)
    print("Shapes: ", X_train.shape, X_test.shape, y_train.shape, y_test.shape)
    model.fit(X_train, y_train)

    y_pred = model.predict(X_test)
    print("Static performance: ", "\n", confusion_matrix(y_test, y_pred))
    print()
    print(classification_report(y_test, y_pred))

    y_pred_proba = model.predict_proba(X_test)
    fpr, tpr, _ = roc_curve(y_test, y_pred_proba[:,1])
    print("AUC score: ", auc(fpr, tpr))
    print()
Classification on original dataset
# classification on original dataset

X, y = X_org.copy(), y_org.copy()
X_train, X_test, y_train, y_test = train_test_split(X, y, test_size=0.3, stratify=y)
print("original distribution: ", len(y[y==0])/len(y), len(y[y==1])/len(y))
print("Train data distribution: ", len(y_train[y_train==0])/len(y_train), len(y_train[y_train==1])/len(y_train))
print("Test data distribution: ", len(y_test[y_test==0])/len(y_test), len(y_test[y_test==1])/len(y_test))

print_result(X_train, X_test, y_train, y_test)
original distribution:  0.99 0.01
Train data distribution:  0.99 0.01
Test data distribution:  0.99 0.01
Shapes:  (7000, 2) (3000, 2) (7000,) (3000,)
Static performance:
 [[2969    1]
 [  18   12]]

              precision    recall  f1-score   support

           0       0.99      1.00      1.00      2970
           1       0.92      0.40      0.56        30

    accuracy                           0.99      3000
   macro avg       0.96      0.70      0.78      3000
weighted avg       0.99      0.99      0.99      3000

AUC score:  0.9161672278338945
- look at Bad Recall1 score. (40%)
- Because of imbalance. (Think of it as detecting threatening objects such as guns and knives)
Minority class (1)에 대해 현저히 낮은 성능을 보인다.
Resampling
SMOTEed dataset
oversampling
from imblearn.over_sampling import SMOTE
oversample = SMOTE()
X, y = oversample.fit_resample(X_org, y_org)
X.shape, y.shape , len(y[y==0]), len(y[y==1])
((19800, 2), (19800,), 9900, 9900)
markers = ['o', '+']
for i in range(2):
    xs = X[:, 0][y == i]
    ys = X[:, 1][y == i]
    plt.scatter(xs, ys, marker=markers[i], label=str(i), s=3)
plt.legend()
plt.show()

Undersampled dataset
Undersampling
from imblearn.under_sampling import RandomUnderSampler

under = RandomUnderSampler()
X, y = under.fit_resample(X_org, y_org)
print(len(y[y==0]), len(y[y==1]))
100 100
markers = ['o', '+']
for i in range(2):
    xs = X[:, 0][y == i]
    ys = X[:, 1][y == i]
    plt.scatter(xs, ys, marker=markers[i], label=str(i))
plt.legend()
plt.show()

Original paper on SMOTE
-
combine SMOTE and Undersampler()
- The original paper on SMOTE suggested combining SMOTE with random undersampling of the majority class.
- We can update the example to first oversample the minority class to have 10 percent the number of examples of the majority class (e.g. about 1,000), then use random undersampling to reduce the number of examples in the majority class to have 50 percent more than the minority class (e.g. about 2,000).
over = SMOTE(sampling_strategy=0.1)
X, y = over.fit_resample(X_org, y_org)
print("oversampled: ", len(y[y==0]), len(y[y==1]))
oversampled: 9900 990
under = RandomUnderSampler(sampling_strategy=0.5)  # ratio
X, y = under.fit_resample(X, y)
print("under-sampled: ", len(y[y==0]), len(y[y==1]))
under-sampled: 1980 990
markers = ['o', '+']
for i in range(2):
    xs = X[:, 0][y == i]
    ys = X[:, 1][y == i]
    plt.scatter(xs, ys, marker=markers[i], label=str(i))
plt.legend()
plt.show()

- SMOTE creates a line bridge with the majority class.
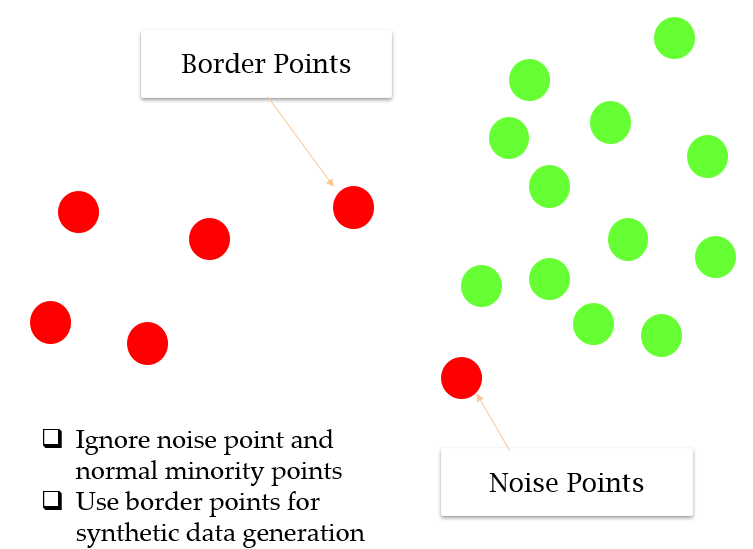
Borderline-SMOTE
- ignore noise points (all the neighbors are majority class) and normal minority class points
- resample only from border points (have both majority and minority classes as neighbors)
- end up giving more attention to extreme points
# Borderline-SMOTE
from imblearn.over_sampling import BorderlineSMOTE
oversample = BorderlineSMOTE(0.1)
X, y = oversample.fit_resample(X_org, y_org)
print(len(y[y==0]), len(y[y==1]))

markers = ['o', '+']
for i in range(2):
    xs = X[:, 0][y == i]
    ys = X[:, 1][y == i]
    plt.scatter(xs, ys, marker=markers[i], label=str(i))
plt.legend()
plt.show()
9900 990

- The plot shows that those examples far from the decision boundary are not oversampled. This includes both examples that are easier to classify (those orange points toward the top left of the plot) and those that are overwhelmingly difficult to classify given the strong class overlap (those orange points toward the bottom right of the plot).
Classification on resampled dataset
SMOTEed dataset
Wrong Example
데이터셋에 대해 처음부터 resampling을 진행하면 안된다.
Resampling은 Train set에 대해서만 이루어지고 Test set에는 실제 데이터만이 있어야 한다.
# resampling first - No !

print("*** Resample First *** \n")
oversample = SMOTE()
X, y = oversample.fit_resample(X_org, y_org)
X_train, X_test, y_train, y_test = train_test_split(X, y, test_size=0.3, stratify=y)
print_result(X_train, X_test, y_train, y_test)
print("Don't be confused...")
*** Resample First ***

Shapes:  (13860, 2) (5940, 2) (13860,) (5940,)
Static performance:
 [[2859  111]
 [ 323 2647]]

              precision    recall  f1-score   support

           0       0.90      0.96      0.93      2970
           1       0.96      0.89      0.92      2970

    accuracy                           0.93      5940
   macro avg       0.93      0.93      0.93      5940
weighted avg       0.93      0.93      0.93      5940

AUC score:  0.9809971771587933
Don't be confused...
Correct Example
데이터셋을 train/test set으로 먼저 나눈다.
그러고 난 후 train set에 대해서만 resampling을 진행한다.
# resample only on Train dataset ! - this is right !
print("*** Split First *** \n")
X_train, X_test, y_train, y_test = train_test_split(X_org, y_org, test_size=0.3, stratify=y_org)
oversample = SMOTE()
X_train, y_train = oversample.fit_resample(X_train, y_train)
print_result(X_train, X_test, y_train, y_test)
*** Split First ***

Shapes:  (13860, 2) (3000, 2) (13860,) (3000,)
Static performance:
 [[2840  130]
 [   5   25]]

              precision    recall  f1-score   support

           0       1.00      0.96      0.98      2970
           1       0.16      0.83      0.27        30

    accuracy                           0.95      3000
   macro avg       0.58      0.89      0.62      3000
weighted avg       0.99      0.95      0.97      3000

AUC score:  0.9396801346801347
Recall1 이 83% 까지 향상되었다.
Undersampled dataset
Train set 의 수가 너무 작아 Overfitting될 위험이 있다.
# undersampling
print("*** Undersampling *** \n")
X_train, X_test, y_train, y_test = train_test_split(X_org, y_org, test_size=0.3, stratify=y_org)
under = RandomUnderSampler()
X_train, y_train = under.fit_resample(X_train, y_train)
print_result(X_train, X_test, y_train, y_test)
*** Undersampling ***

Shapes:  (140, 2) (3000, 2) (140,) (3000,)
Static performance:
 [[2567  403]
 [   2   28]]

              precision    recall  f1-score   support

           0       1.00      0.86      0.93      2970
           1       0.06      0.93      0.12        30

    accuracy                           0.86      3000
   macro avg       0.53      0.90      0.52      3000
weighted avg       0.99      0.86      0.92      3000

AUC score:  0.967996632996633
Use both SMOTE & Undersampling
from sklearn.tree import DecisionTreeClassifier
from sklearn.model_selection import RepeatedStratifiedKFold, cross_val_score
# use both SMOTE and Underssampler
X_train, X_test, y_train, y_test = train_test_split(X_org, y_org, test_size=0.3, stratify=y_org)
over = SMOTE(sampling_strategy=0.1)
X_train, y_train = over.fit_resample(X_train, y_train)
under = RandomUnderSampler(sampling_strategy=0.5)
X_train, y_train = under.fit_resample(X_train, y_train)
print_result(X_train, X_test, y_train, y_test)
Shapes:  (2079, 2) (3000, 2) (2079,) (3000,)
Static performance:
 [[2887   83]
 [   7   23]]

              precision    recall  f1-score   support

           0       1.00      0.97      0.98      2970
           1       0.22      0.77      0.34        30

    accuracy                           0.97      3000
   macro avg       0.61      0.87      0.66      3000
weighted avg       0.99      0.97      0.98      3000

AUC score:  0.9530695847362514
# Use stratified K-Fold

from sklearn.model_selection import StratifiedKFold

X, y = X_org.copy(), y_org.copy()
cv = StratifiedKFold(n_splits=5, shuffle=True)
score = []

for train_idx, test_idx in cv.split(X_org, y_org): # 5 repetition
    X_train, y_train = X[train_idx], y[train_idx]
    X_test, y_test = X[test_idx], y[test_idx]

    over = SMOTE(sampling_strategy=0.1)
    X_train, y_train = over.fit_resample(X_train, y_train)
    under = RandomUnderSampler(sampling_strategy=0.5)  # ratio
    X_train, y_train = under.fit_resample(X_train, y_train)

    print_result(X_train, X_test, y_train, y_test)
Shapes:  (2376, 2) (2000, 2) (2376,) (2000,)
Static performance:
 [[1920   60]
 [   3   17]]

              precision    recall  f1-score   support

           0       1.00      0.97      0.98      1980
           1       0.22      0.85      0.35        20

    accuracy                           0.97      2000
   macro avg       0.61      0.91      0.67      2000
weighted avg       0.99      0.97      0.98      2000

AUC score:  0.9767424242424242

Shapes:  (2376, 2) (2000, 2) (2376,) (2000,)
Static performance:
 [[1937   43]
 [   5   15]]

              precision    recall  f1-score   support

           0       1.00      0.98      0.99      1980
           1       0.26      0.75      0.38        20

    accuracy                           0.98      2000
   macro avg       0.63      0.86      0.69      2000
weighted avg       0.99      0.98      0.98      2000

AUC score:  0.9520454545454544

Shapes:  (2376, 2) (2000, 2) (2376,) (2000,)
Static performance:
 [[1938   42]
 [   4   16]]

              precision    recall  f1-score   support

           0       1.00      0.98      0.99      1980
           1       0.28      0.80      0.41        20

    accuracy                           0.98      2000
   macro avg       0.64      0.89      0.70      2000
weighted avg       0.99      0.98      0.98      2000

AUC score:  0.9510858585858586

Shapes:  (2376, 2) (2000, 2) (2376,) (2000,)
Static performance:
 [[1939   41]
 [   6   14]]

              precision    recall  f1-score   support

           0       1.00      0.98      0.99      1980
           1       0.25      0.70      0.37        20

    accuracy                           0.98      2000
   macro avg       0.63      0.84      0.68      2000
weighted avg       0.99      0.98      0.98      2000

AUC score:  0.9346464646464646

Shapes:  (2376, 2) (2000, 2) (2376,) (2000,)
Static performance:
 [[1939   41]
 [   4   16]]

              precision    recall  f1-score   support

           0       1.00      0.98      0.99      1980
           1       0.28      0.80      0.42        20

    accuracy                           0.98      2000
   macro avg       0.64      0.89      0.70      2000
weighted avg       0.99      0.98      0.98      2000

AUC score:  0.9304671717171717
Different values of the k-nearest neighbors selected in the SMOTE
X_org, y_org = make_classification(n_samples=10000, n_features=2, n_redundant=0,
	                       n_clusters_per_class=1, weights=[0.99], flip_y=0,
                           random_state=1)
k_values = [1,10,20,30,40]

for k in k_values:
    X_train, X_test, y_train, y_test = train_test_split(X_org, y_org, test_size=0.3, stratify=y_org)
    over = SMOTE(sampling_strategy=0.1, k_neighbors=k) # k_neighbors defualt=5
    X_train, y_train = over.fit_resample(X_train, y_train)
    under = RandomUnderSampler(sampling_strategy=0.5)
    X_train, y_train = under.fit_resample(X_train, y_train)

    print_result(X_train, X_test, y_train, y_test)
Shapes:  (2079, 2) (3000, 2) (2079,) (3000,)
Static performance:
 [[2872   98]
 [   6   24]]

              precision    recall  f1-score   support

           0       1.00      0.97      0.98      2970
           1       0.20      0.80      0.32        30

    accuracy                           0.97      3000
   macro avg       0.60      0.88      0.65      3000
weighted avg       0.99      0.97      0.98      3000

AUC score:  0.9604545454545456

Shapes:  (2079, 2) (3000, 2) (2079,) (3000,)
Static performance:
 [[2908   62]
 [   7   23]]

              precision    recall  f1-score   support

           0       1.00      0.98      0.99      2970
           1       0.27      0.77      0.40        30

    accuracy                           0.98      3000
   macro avg       0.63      0.87      0.69      3000
weighted avg       0.99      0.98      0.98      3000

AUC score:  0.9728451178451178

Shapes:  (2079, 2) (3000, 2) (2079,) (3000,)
Static performance:
 [[2869  101]
 [   3   27]]

              precision    recall  f1-score   support

           0       1.00      0.97      0.98      2970
           1       0.21      0.90      0.34        30

    accuracy                           0.97      3000
   macro avg       0.60      0.93      0.66      3000
weighted avg       0.99      0.97      0.98      3000

AUC score:  0.92172278338945

Shapes:  (2079, 2) (3000, 2) (2079,) (3000,)
Static performance:
 [[2902   68]
 [   9   21]]

              precision    recall  f1-score   support

           0       1.00      0.98      0.99      2970
           1       0.24      0.70      0.35        30

    accuracy                           0.97      3000
   macro avg       0.62      0.84      0.67      3000
weighted avg       0.99      0.97      0.98      3000

AUC score:  0.9804545454545455

Shapes:  (2079, 2) (3000, 2) (2079,) (3000,)
Static performance:
 [[2919   51]
 [   6   24]]

              precision    recall  f1-score   support

           0       1.00      0.98      0.99      2970
           1       0.32      0.80      0.46        30

    accuracy                           0.98      3000
   macro avg       0.66      0.89      0.72      3000
weighted avg       0.99      0.98      0.98      3000

AUC score:  0.9852020202020202
Borderline-SMOTE
from sklearn.model_selection import RepeatedStratifiedKFold
from imblearn.over_sampling import BorderlineSMOTE

cv = RepeatedStratifiedKFold(n_splits=5, n_repeats=1)

for train_idx, test_idx in cv.split(X_org, y_org):
    X_train, y_train = X[train_idx], y[train_idx]
    X_test, y_test = X[test_idx], y[test_idx]

    over = BorderlineSMOTE(sampling_strategy=0.1)
    X_train, y_train = over.fit_resample(X_train, y_train)
    under = RandomUnderSampler(sampling_strategy=0.5)  # ratio
    X_train, y_train = under.fit_resample(X_train, y_train)

    print_result(X_train, X_test, y_train, y_test)
Shapes:  (2376, 2) (2000, 2) (2376,) (2000,)
Static performance:
 [[1954   26]
 [   5   15]]

              precision    recall  f1-score   support

           0       1.00      0.99      0.99      1980
           1       0.37      0.75      0.49        20

    accuracy                           0.98      2000
   macro avg       0.68      0.87      0.74      2000
weighted avg       0.99      0.98      0.99      2000

AUC score:  0.9435606060606061

Shapes:  (2376, 2) (2000, 2) (2376,) (2000,)
Static performance:
 [[1936   44]
 [   0   20]]

              precision    recall  f1-score   support

           0       1.00      0.98      0.99      1980
           1       0.31      1.00      0.48        20

    accuracy                           0.98      2000
   macro avg       0.66      0.99      0.73      2000
weighted avg       0.99      0.98      0.98      2000

AUC score:  0.9959469696969697

Shapes:  (2376, 2) (2000, 2) (2376,) (2000,)
Static performance:
 [[1960   20]
 [   7   13]]

              precision    recall  f1-score   support

           0       1.00      0.99      0.99      1980
           1       0.39      0.65      0.49        20

    accuracy                           0.99      2000
   macro avg       0.70      0.82      0.74      2000
weighted avg       0.99      0.99      0.99      2000

AUC score:  0.9078030303030303

Shapes:  (2376, 2) (2000, 2) (2376,) (2000,)
Static performance:
 [[1960   20]
 [   8   12]]

              precision    recall  f1-score   support

           0       1.00      0.99      0.99      1980
           1       0.38      0.60      0.46        20

    accuracy                           0.99      2000
   macro avg       0.69      0.79      0.73      2000
weighted avg       0.99      0.99      0.99      2000

AUC score:  0.9350883838383839

Shapes:  (2376, 2) (2000, 2) (2376,) (2000,)
Static performance:
 [[1956   24]
 [   5   15]]

              precision    recall  f1-score   support

           0       1.00      0.99      0.99      1980
           1       0.38      0.75      0.51        20

    accuracy                           0.99      2000
   macro avg       0.69      0.87      0.75      2000
weighted avg       0.99      0.99      0.99      2000

AUC score:  0.961590909090909
Leave a comment